Why the choice of carbon metric is important
Understanding different carbon metrics is important for investors who are looking to identify their carbon risk exposures and manage their carbon targets, because:
- Investors can over or underestimate the climate impact of their investment decisions if the key underlying drivers of change are not well understood
- Investors may misinterpret changes in carbon metrics for real-world impact
- Investors may fail to manage their carbon targets effectively if market volatility leads to major fluctuations in carbon metrics, particularly EVIC-based metrics
The three core carbon metrics
The table below shows the three core portfolio-level carbon metrics. These three metrics are used widely and are aligned to leading industry and regulatory standards. The Taskforce on Climate-Related Financial Disclosure (TCFD) encouraged Weighted Average Carbon Intensity (WACI) as the core metric to disclose in 2017. Then in 2020, the Partnership for Carbon Accounting Financials (PCAF) set EVIC-based ‘Financed Emissions’ as the new, consistent carbon disclosure standard for investors.
Table 1: Core carbon metrics
| Core Portfolio-Level Metrics | Unit | Absolute or Intensity |
|---|---|---|
| Financed Emissions | tCO2e | Absolute |
| Economic Emissions Intensity | tCO2e/$m Invested | Intensity |
| Weighted Average Carbon Intensity (WACI) | tCO2e/$m Revenue | Intensity |
Financed Emissions
Financed Emissions calculate the absolute tonnes of CO2 that are financed or ‘owned’ by investors across both equity and credit. The metric attributes ownership of emissions based on the percentage of enterprise value including cash (EVIC) owned by the investor.

EVIC is the sum of market capitalisation plus total debt. Market capitalisation is driven by fundamentals (earnings) and market valuations as measured by Price Earnings (P/E ratios). Similarly, total debt will change with a company’s debt financing decisions. As such, if share prices fall due to a contraction in P/E ratios, EVIC will fall. In this scenario, fixed income investors will own a greater slice of EVIC, and as such, assuming emissions stay constant, fixed income investors will see a rise in Financed Emissions, while equity investors will see a fall in Financed Emissions, as they own a smaller slice of EVIC. These dynamics are explored in more detail in this short research paper.
It is of course the change in absolute emissions that matters for real world impact. However, to make carbon emissions comparable across companies and investors of differing size, and to allow for growth in fund assets, emissions need to be normalised. This produces the carbon intensity measures. ‘Economic Emissions Intensity’ was introduced as a term by PCAF and uses EVIC to normalise emissions. In contrast, WACI uses revenue in the denominator to normalise emissions.
Revenue or EVIC as denominators – what’s the impact?
Revenue and EVIC can move in opposite directions. Therefore, WACI and Economic Emissions Intensity can move in opposite directions, given their sensitivity to changes in their denominator. We show this using the company example of Orsted. Previously an oil & gas company, Orsted has gone through a transformation to become one of the largest offshore wind energy producers.
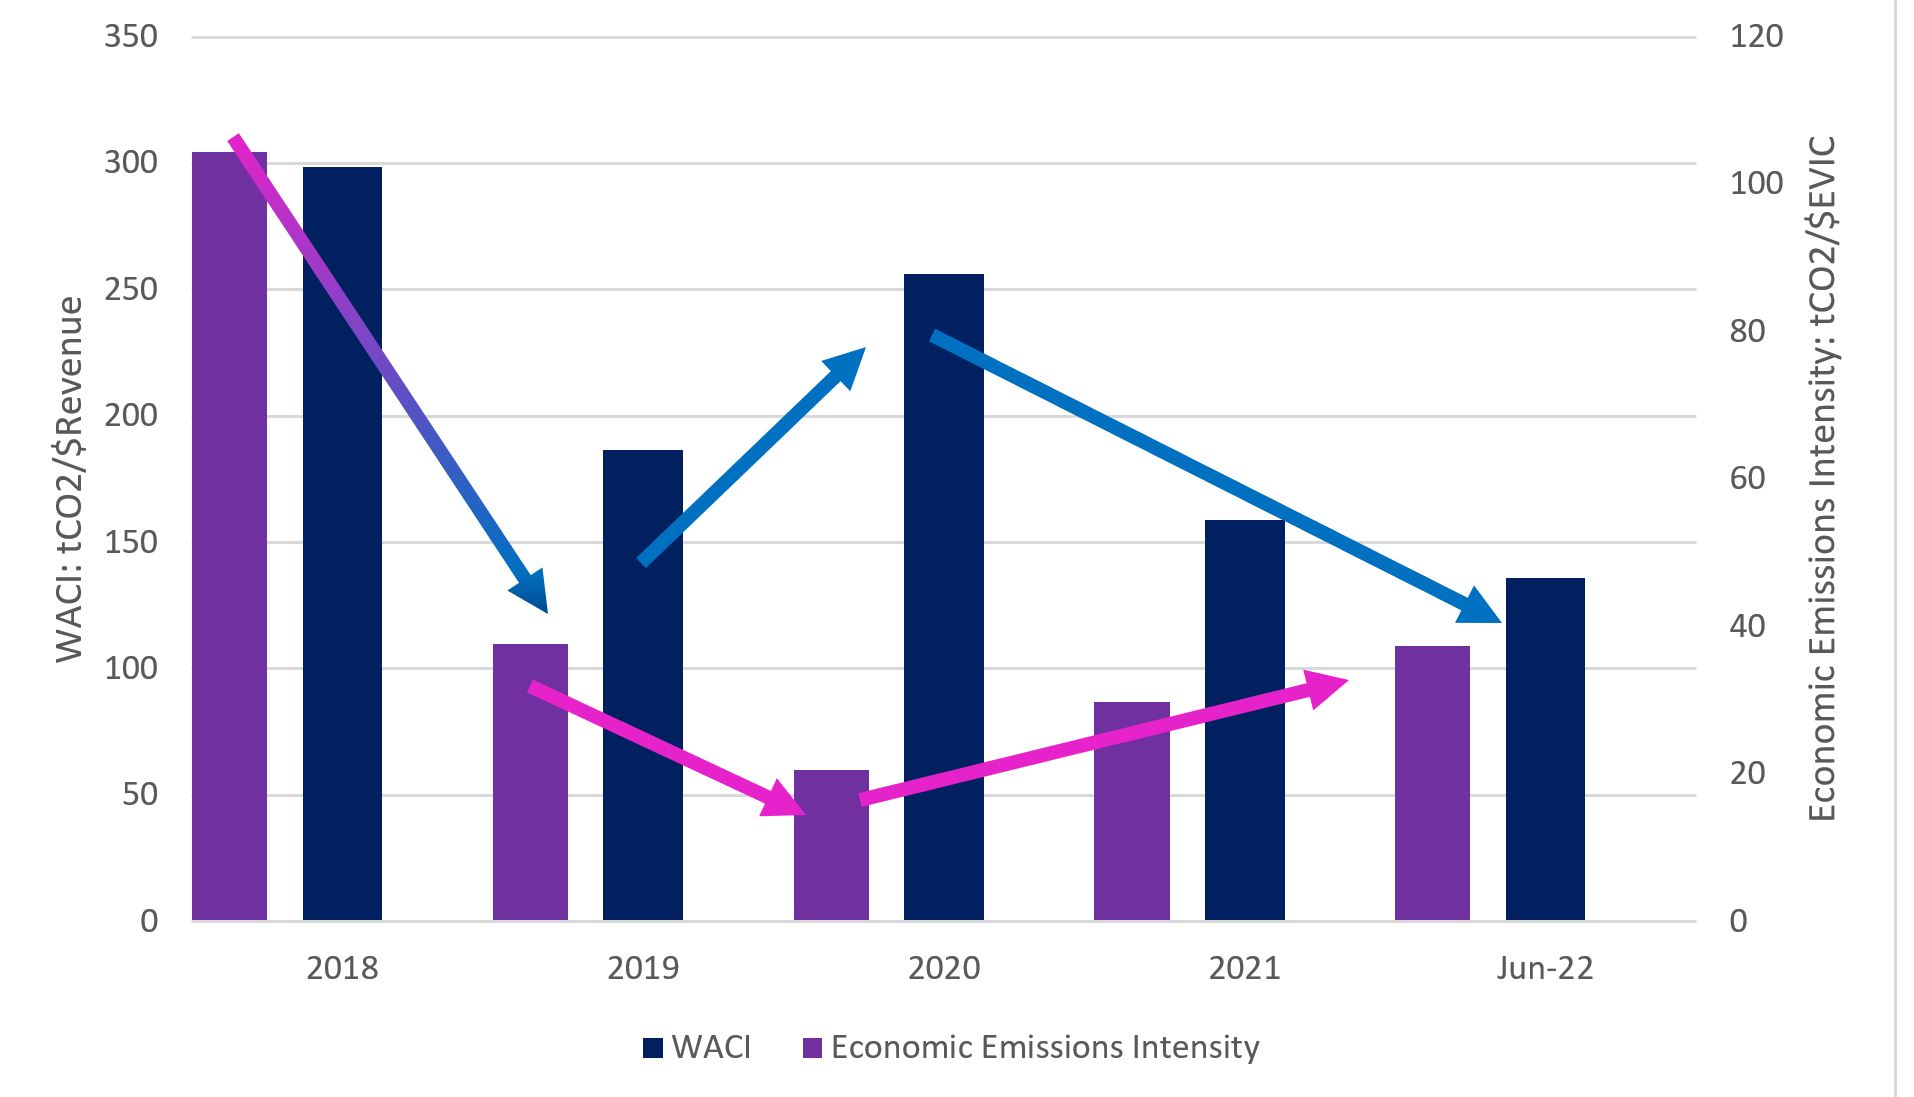
In Chart 1, we have calculated WACI and Economic emission intensity metrics for Orsted for the period 2018-2022. We have taken historical carbon data for the period 2018 – 2020. To calculate 2021 and 2022 metrics, we have taken 2021 and 2022 financial data with the most up-to-date emissions data (from 2020). We can see a complete divergence in WACI and Economic Emissions Intensity in 2020, 2021 and 2022.
Chart 1: Orsted carbon metric divergence
It is important to understand how the components underlying these metrics have changed, which is shown in Table 1 below, using annual percentage changes. We also consider the total emissions of Orsted, which shows the company has been successful in decarbonising its operations.
Table 1: Orsted carbon metrics – understanding changes in underlying components
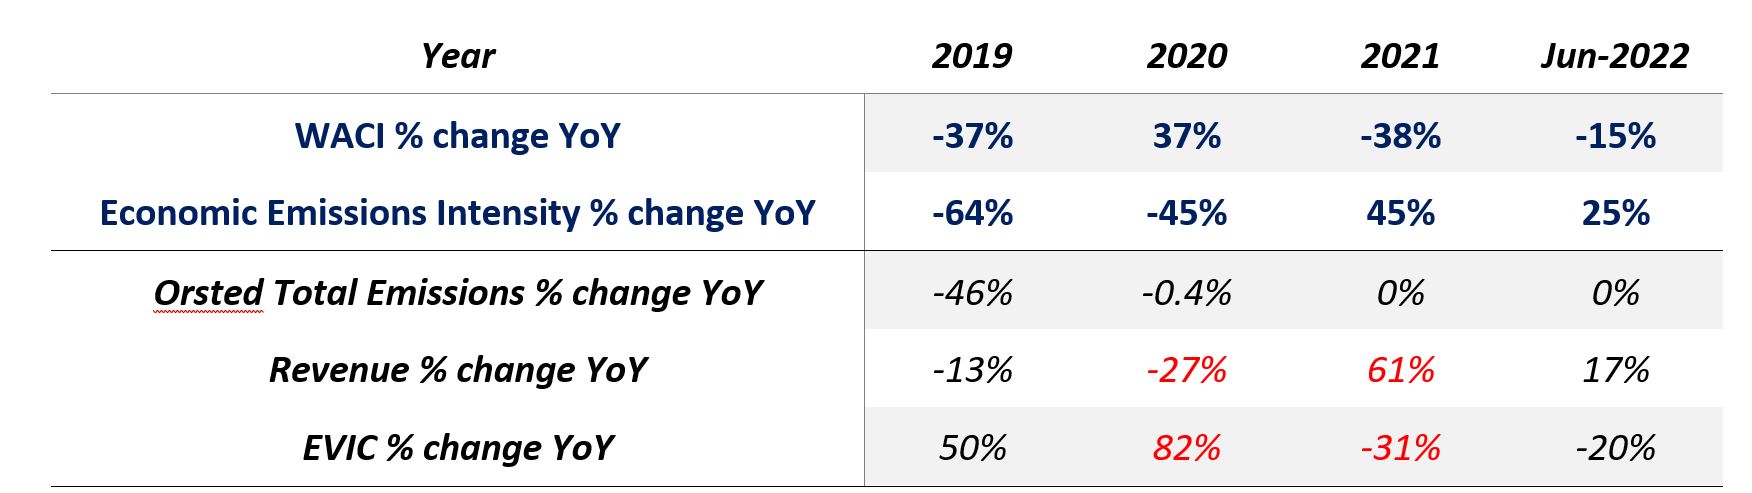
Source: Trucost, Bloomberg, abrdn. Company shown for illustrative purposes only.
The divergence is clearly being driven by changes in revenue and EVIC. For example, in 2020 a fall in revenues led to an increase in WACI, while an increase in EVIC led to a decrease in Economic Emissions Intensity – with almost no reduction in absolute emissions. In 2021, we had the exact opposite scenario. Moreover, even where the intensity metrics move in the same direction, we can see their magnitude in change is highly variable. In 2019, Economic Emissions Intensity decarbonised by nearly double that of WACI.
So which metric should investors choose?
Each carbon metric will answer a slightly different question:
- WACI provides insight into a company’s carbon efficiency per dollar of revenue earned and is a useful metric for comparing companies within sectors.
- Economic Emissions Intensity is a useful measure to understand the carbon intensity relative to the value invested and allows for asset management growth of a portfolio to be normalised.
- Financed Emissions provide an important absolute view of emissions ‘owned’ by different investors. However apportioning based on % of EVIC-owned is still imperfect since changes may be driven by volatility affecting the market values of company equity and debt
Since all these metrics have strengths and weaknesses, it’s imperative to track them all. Moreover, short-term volatility illustrates the need for disaggregation. To capture the full picture, investors should also track total company emissions as shown in Table 1.
“When considering carbon emissions, what matters more to investors is not where carbon emissions are today, but rather where they will be in the future….”
The importance of a forward-looking view
When considering carbon emissions, what matters more to investors is not where carbon emissions are today, but rather where they will be in the future for a company or portfolio. To obtain this forward-looking view of emissions, we need to forecast the key components, namely:
- Absolute emissions: This can be obtained from climate scenario analysis emission forecasts and credible company targets
- Revenues: These can be assumed to grow at a constant percentage in line with economic growth
- EVIC: Forecasting EVIC is a lot more difficult and prone to volatility, therefore posing challenges for investors with long-term view
When intensities are being forecasted, it is imperative that investors clearly outline the underlying assumptions made in terms of revenue and EVIC growth.
What are the key implications for investors?
- All three carbon metrics should be disclosed and disaggregated
The choice of carbon metric matters - all metrics provide investors with different, sometimes opposing views on carbon and should be disclosed.
Disaggregating the metrics is necessary to examine the underlying drivers of change, particularly in cases where changes in carbon metrics are unrelated to carbon fundamentals. For example, when changes in EVIC are due to market volatility, or when revenue shocks impact final results.
It can also be beneficial to consider total company absolute emissions to complement the carbon metrics. However, it must be understood that normalising emissions is important and necessary for investors to compare companies of different sizes and funds of different sizes. At abrdn, we refer to this as ‘Fiduciary Carbon Risk Management’.
- Most importantly, we need a forward-looking view on carbon and credible targets
Backward-looking carbon metrics should be complemented with a more forward-looking view using scenario analysis, corporate emissions targets and an assessment of their credibility, as well as green revenues and green capex data. These elements all support the development of a forward-looking view on carbon. It is important to be aware that data availability can sometimes be sparse and forward-looking methodologies are relatively nascent. Nevertheless, we think that investors should attempt to incorporate this type of data as best as possible, using an approach that transparently accounts for any data gaps.
- Focusing on carbon metrics alone is not sufficient for real-world decarbonisation
Using carbon metrics alone will leave investors at risk of making decisions that are mis-aligned with climate goals. It is crucial that carbon emissions are measured, reported and benchmarked. But this is only one component of abrdn’s Net-Zero Directed Investing toolkit. We believe that supporting real world decarbonisation also requires strong active ownership and other net zero-focused investment solutions.