That’s why we launched our ‘Innovation Superstars’ research series last year, to better understand this process and to help us quickly spot success stories.
In the first instalment – Identifying the most productive US-listed firms – we used productivity as a way to benchmark the effects of innovation across firms in the Russell 3000 Index. This uncovered large, and sustained, differences between innovators and laggards.
For the second paper in this series – The search for clusters of innovators – we compiled a bespoke database of innovation indictors, using millions of datapoints, to better understand the similarities across the most innovative US companies.
This is what we found.
Bringing together innovation proxies
We looked at a range of innovation indicators for individual firms in the Russell 3000 Index over a 20-year period:
- Traditional innovation measures – research and development (R&D) spend with data adjusted for company size (bigger firms tend to spend more on R&D); and investments in intangible assets such as human capital, software, branding and databases.
- Patents databases – data on patents filed at US or European patent offices allow us to calculate the number of patents filed each year, and on a rolling 20-year basis; data adjusted for quality, scope and citations.
- Financing innovation – financial metrics – interest-coverage and debt-to-equity ratios, sales per employee, profit margins – indicate a company’s ability to fund innovation.
Creating ‘clusters’
Next, we used a data science technique called ‘clustering’ to group together companies with similar characteristics across these innovation indicators.
These clusters are useful in that they allow us to think about the shared characteristics of companies from an innovation perspective. There are five clusters, ranked from most to least productive:
- Patent machines – These companies boast the highest scores on patent-filing frequency and quality. They have strong financial metrics; are mid-ranked for R&D intensity and are the largest investors in intangible assets. Examples include well-known names like Amazon, Apple, Meta and Microsoft.
- Innovation all-rounders – This group files patents more frequently than most firms in the Russell index. They lag ‘Patent machines’ on the frequency and quality of these patents but spend more on R&D. They rank around average for intangible investments. Examples include Nvidia, Mastercard, Visa, Accenture and GoPro.
- Innovation laggards and Midtable mediocrity – These companies deliver productivity that is average or below average for firms in the Russell index and are near bottom of the class for innovative activities; associated with the lowest patent filings and quality; low investment in R&D and intangible assets. Their financial health varies.
- Inefficient innovators – Firms in this cluster rank worst for productivity but they file relatively high-quality patents at an average pace and outperform on R&D spending and intangible-assets investment. Their poor productivity might be evidence that innovation activities do not guarantee success, or that they are engaging in R&D activities with a high risk of failure (such as in the pharmaceuticals industry).
Innovation immobility?
A study of these clusters over time shows little movement between groups. Most migration occurs between the ‘Innovation laggards’ and ‘Midtable mediocrity’ clusters – perhaps a reflection of their relative size compared to the others.
That said, there are exceptions. For example, Amazon started out as an ‘Inefficient innovator’ before progressing up via ‘Innovation all-rounders’ to its current position in the ‘Patent machines’ group. In this instance, greater productivity coincided with innovation proxy-improvements.
Innovation payoffs?
In our first paper we uncovered a correlation between higher productivity (a proxy for innovation) and stronger returns at the company level.
Testing this observation with our clusters, we see a more complicated and nuanced relationship emerge. What’s striking is the degree of overlap across clusters.
Chart: Returns, productivity and clusters
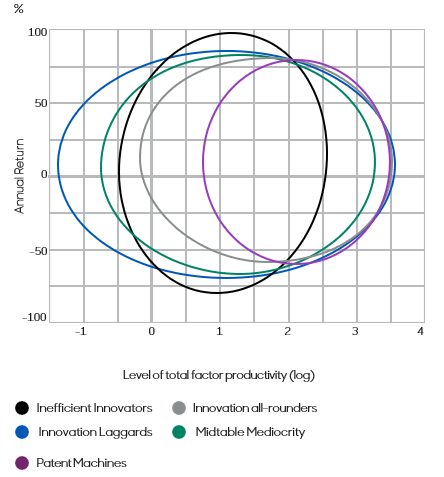
Source: OECD, Worldscope, Refinitiv, abrdn, as of 2019
For example, ‘Patent machines’ and ‘Innovation all-rounders’ boast the highest productivity, but their returns profile does not differ much from other clusters. At the other end of the spectrum, ‘Inefficient innovators’ are least productive, but returns aren’t that much different either.
It is likely that other firm characteristics, such as their size, the sector they operate in, or external factors like business cycle effects, are clouding this relationship.
It is likely that other firm characteristics, such as their size, the sector they operate in, or external factors like business cycle effects, are clouding this relationship
This means a more sophisticated analysis will be needed to explain the relationship between productivity and returns.
Final thoughts
Our database of innovation indicators helps shine a light on those firms working hardest to deliver breakthroughs – with many of them outperforming across traditional metrics such as investment in R&D and intangible assets, patent quantity and quality.
Importantly, these companies are often the most productive, hinting at a tangible payoff from innovation efforts in the form of corporate performance. However, this relationship isn’t perfect.
Company rankings across our innovation indicators have been relatively stable over the past two decades. This suggests a strong culture of innovation within those firms trying to innovate most intensively, which is hard to replicate elsewhere. This makes it important for investors to identify these ‘Innovation Superstars’.
Less clear is the relationship between innovation activities and returns. In our next paper, we will deepen the analysis by testing the relationship between innovation activities, productivity and returns using a more sophisticated model which allows us to control for additional factors, such as other firm characteristics and the business cycle.
That study lays the foundation for the abrdn Innovation Index, which we hope will help us to identify the next generation of ‘Innovation Superstars’.
IMPORTANT INFORMATION
Any individual companies or other securities discussed above have been selected for illustrative purposes only to demonstrate abrdn's views or investment management style. They're not meant as an investment recommendation, indication of future performance or as an indication of any holdings by abrdn.
US-140223-187948-1